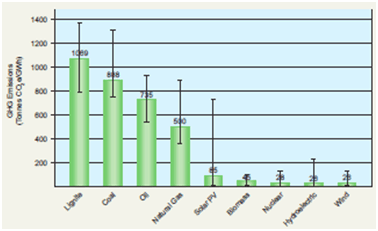
Nuclear power has near-zero emissions as can be seen from the chart here. This shows that the low-carbon technologies are wind, hydro, nuclear, biomass and solar PhotoVoltaic. The green bars indicate the median values of a range of different studies by reputable organisations, while the black bars indicate the range of values found in the various studies.
Note that these emissions values for nuclear include the entire lifecycle emissions, including mining, processing, enrichment, fuel fabrication, operation, reprocessing if applicable and also an allowance for final spent fuel storage.
The chart indicates a median value for nuclear of 28 tonnes of carbon dioxide per Gigawatt hour. This means that a 1000 MW nuclear station would be responsible for 28 tonnes of CO2 per hour at full load. In a typical year, operating at 90% of full capacity, the annual emissions from that nuclear station would be 28 * 8760 * 0.9 = 221,000 tonnes of CO2.
This is a lot of CO2 but it is small compared to the emissions from a coal fired station producing the same energy, which would emit 848 * 8760 * 0.9 = 6,680,000 tonnes of CO2 per year.
So, a nuclear station the size of Moneypoint (900 MW) would save over 5 million tonnes of CO2 per year compared to coal and over 2.5 million tonnes compared to gas-fired combined cycle plant.
Each of the low carbon options (solar, biomass, nuclear, hydroelectric and wind) should be assessed before deciding on our energy strategy for a sustainable future. This assessment is best conducted by an independent group of experts.